"The US average is 18.83 ¢/kWh, so that is roughly what I pay." Not really.
The US average is a national arithmetic mean that almost no household actually pays. The same number that reads 18.83 ¢/kWh nationally is 41 ¢/kWh on the same EIA spreadsheet row for Hawaii and 11 ¢/kWh for North Dakota. A 4x spread is not a rounding issue; it is the headline.
Three structural drivers produce that gap, and only one of them can move year to year. Fuel mix: a state burning oil for baseload (Hawaii) cannot pay what a state running on federal hydro (Washington) pays, regardless of policy. Geography: an isolated grid (Hawaii, Alaska, parts of Texas) cannot import cheap power from a neighbour; a state inside a large wholesale market can. Climate and reliability policy layer: California, New York and Massachusetts add several cents per kWh in surcharges and capacity uplift that North Dakota does not.
Wholesale competition can compress the supply portion of the bill. It cannot compress the other two thirds. That is why the only US state where competitive retail produced consistent residential savings is Texas, and even there the savings come from the bill-credit and free-nights structures that exist only because the utility was forced out of default service in 2002.
Read the next section as a map of where the variation actually comes from, not as a list of "expensive" and "cheap" states. The numbers are the result of the structural drivers; they do not change by shopping.
What the per-kWh rate is, and what it is not.
Three different things hide behind the same "¢/kWh" figure. They matter when you compare quotes or read a bill.
All-in residential rate (EIA)
The EIA average price is total residential revenue divided by total residential kWh sold. It bundles generation, transmission, distribution, customer charges, taxes and riders. This is the closest figure to "what households actually pay per kWh" and the one we use throughout this page. US average for March 2026: 18.83 ¢/kWh.
Supply-only rate (retail offer)
In retail-choice states the supplier quotes only the generation portion: roughly 40 to 50% of the all-in rate. A 10 ¢/kWh fixed offer in Pennsylvania is not "half the EIA number". Delivery, customer charge and riders sit on a separate line, billed by the utility. Always compare supply-only against the utility "price to compare", not against the EIA all-in figure.
Marginal vs effective rate
Some utilities use tiered or seasonal rates: the first 500 kWh at one price, the next 500 at another. The "marginal" rate (what one more kWh costs you tonight) can be very different from the "effective" rate (your total bill divided by your kWh). Texas free-nights plans and California tiered residential rates produce the largest gaps between the two.
The detail that surprises most readers. The headline EIA figure includes the customer charge, the delivery line, every public-benefit rider and every climate surcharge. When a retail supplier quotes "8.99 ¢/kWh fixed", they are quoting roughly 40 to 50% of what you actually pay per kWh, not the whole bill. The supplier offer can only move the supply slice. Everything else is still set by the regulated utility and the state PUC.
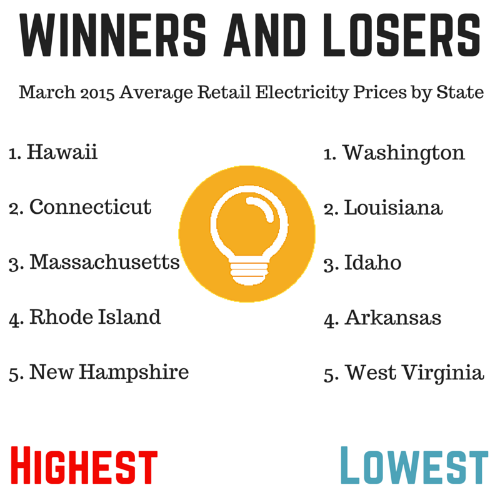
The five most and five least expensive states, with the reason.
Residential prices for March 2026, in cents per kWh. Source: EIA Electric Power Monthly, Table 5.6.A, released 21 May 2026.
Top 5 most expensive
| State | ¢/kWh | Why |
|---|---|---|
| Hawaii | 41.21 | Oil-fired baseload; isolated grid; no organized wholesale market |
| California | 31.05 | Wildfire mitigation + climate riders + IOU rate cases |
| Massachusetts | 29.78 | ISO-NE gas dependence; supply share rising |
| Connecticut | 29.31 | Eversource and UI default-service auction laddering |
| New York | 28.55 | NYISO Zone J (NYC) and K (Long Island) lift the state average |
Bottom 5 least expensive
| State | ¢/kWh | Why |
|---|---|---|
| North Dakota | 11.04 | Lignite and wind dominate; vertically integrated IOUs |
| Nebraska | 11.18 | Public-power state, no shareholder dividend layer |
| Oklahoma | 11.74 | Cheap gas + wind; SPP market; low transmission constraint |
| Washington | 11.83 | Federal hydro from BPA at below-market rates |
| Idaho | 11.97 | Hydro-dominant; vertically integrated IOUs; no wholesale market |
! The middle of the table tells you the most
Texas (~14.3 ¢/kWh), Pennsylvania (~18.5 ¢/kWh), Ohio (~16.0 ¢/kWh), Illinois (~17.4 ¢/kWh) and Florida (~15.5 ¢/kWh) cluster around the US mean. These are the markets where the supply-vs-delivery split is comparable, the wholesale layer is roughly $40 to $60/MWh, and a 1 to 2 ¢/kWh shopping spread is realistic. Hawaii and California are not benchmarks for anyone outside Hawaii and California.
Four layers that build the per-kWh rate.
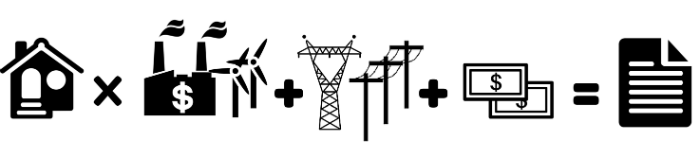
A residential price is the sum of four costs the utility has to recover. The headline rate is just the addition.
A Fuel mix
Coal, gas, nuclear, hydro, wind, oil, solar each clear at different costs. A state running 60% hydro pays a different fuel bill from a state running 80% gas. Hawaii burns oil because no pipeline reaches it; that alone explains more than half its rate gap with the mainland.
B Transmission and constraint
A constrained transmission line pushes the price up on the importing side and down on the exporting side. PJM Zone J (NYC), CAISO LA Basin and ERCOT Houston all carry transmission premiums that show up in residential rates years after the constraint emerges.
C Climate and policy riders
California (wildfire mitigation, climate credit), New York (CLCPA, ZEC nuclear support), Illinois (CEJA), Massachusetts and the rest of the Northeast add 2 to 5 ¢/kWh in named riders that no shopping can remove. North Dakota, Wyoming and Idaho add almost none.
D Regulated vs deregulated
In a regulated state (most of the South, Pacific Northwest, Mountain West), one vertically integrated utility owns generation, transmission and distribution; the per-kWh rate is whatever the state PUC approves in the next rate case. In a retail-choice state (TX, PA, OH, NY, IL, MA, MD, NJ, CT, etc.), supply is split off and clears against a wholesale market. Neither model is universally cheaper; both produce the same headline kWh figure once everything is added.
The takeaway: when you compare your state to the US average, what you are really comparing is the sum of these four layers. Two states with the same wholesale gas cost can land 5 ¢/kWh apart because of layers B, C and D.
The capacity-auction shock now pricing into bills.
If you live in a PJM state, the per-kWh rate you pay in 2026 reflects two specific auctions held in 2024 and 2025. They are not in EIA\'s March 2026 reading yet for the new vintage; they show up in your bill from June 2026.
PJM /MW-day, 2026/27
22 July 2025 auction, the maximum FERC allows under the new Net CONE cap. Hits PJM-state default supply rates in June 2026.
YoY capacity jump
Up from $269.92/MW-day for 2025/2026; that prior year was a 9-fold jump from $28.92. The capacity line is no longer a rounding figure on the bill.
PJM all-in impact
Independent estimates put the bill impact at roughly 1 to 3 ¢/kWh added to default supply across PJM zones, depending on utility load shape and how much capacity each zone needs.
US avg, Mar 2026
Latest verified EIA reading, released 21 May 2026. The PJM 2025/2026 capacity step (June 2025) is already in this figure; the 2026/2027 step is not.
Three things the new numbers actually mean
- A The PJM state group reprices in June 2026. IL ComEd, OH, PA, NJ, MD, DC, VA, DE, WV, eastern KY, NC, IN and MI default supply rates step up. A fixed-rate retail contract signed before that date locks in the pre-step pricing for the term.
- B Non-PJM states do not see this shock. Ameren IL (MISO), all of Texas (ERCOT), California (CAISO), the New England states (ISO-NE), and every regulated Southeast or Pacific Northwest state run on a different mechanic. Their bills may move for other reasons, but not from this auction.
- C The energy-charge component is still set by gas. EIA\'s May 2026 Short-Term Energy Outlook projects Henry Hub gas in the $3 to $4/MMBtu range through 2026. The capacity layer is the new pressure; the energy layer is roughly flat.
Why the 4x state gap will not close from shopping.
Four structural reasons that the per-kWh spread between states has stayed at roughly 4x since EIA started publishing the data the same way. None of them are addressable at the retail layer.
Geography sets the floor
An isolated grid pays the cost of its most expensive fuel. Hawaii burns oil because there is no pipeline; ERCOT cannot import meaningful power from neighbouring grids. North Dakota sits on lignite seams. Federal hydro from BPA flows below market to Washington, Oregon and Idaho. None of this changes from a retail offer.
Climate policy is priced at the wires
California\'s wildfire-mitigation rider, New York\'s CLCPA implementation, Illinois\' CEJA, Massachusetts\' clean-energy programmes all show up as line items on residential bills. They are not shoppable. In 2026 these layers add 2 to 5 ¢/kWh in the states that adopted them and roughly 0 in those that did not.
Supply share has shrunk to ~40 to 50%
The portion of your bill that a competitive supplier can quote on is now 40 to 50% of the total, down from roughly 60% in the late 1990s. Even a 15% supplier discount becomes 6 to 8% off the all-in bill. The remaining half is delivery, rider and policy that no retail offer can compress.
Texas is the exception that proves the rule
ERCOT is the only US wholesale market that produces consistent residential supply savings against the regulated benchmark, and even there the savings come from product design (bill-credit thresholds, free-nights plans) that exist because the utility was removed from default service in 2002. Every other retail-choice state still has a regulated default rate that anchors prices; shopping moves you a few percent around that anchor.
The honest answer to "why does Hawaii pay 4x what North Dakota pays" is geography, fuel mix and policy in that order, with wholesale competition as a marginal modifier. The per-kWh rate is the symptom; these four layers are the cause.
Six things you can actually do with the per-kWh rate.
Read your own bill
Find the "price to compare" or "default supply rate" on your utility bill. That is the number a retail offer has to beat in supply-only terms. If you cannot find it, your utility\'s website lists it monthly.
Multiply by your kWh, not the US average
A 1,500 kWh/month all-electric home in Texas pays a very different bill from an 800 kWh/month gas-heated home. Use your last 12 months of bills to find your true usage, then multiply by your state\'s effective rate.
Lock before June 2026 if you are in a PJM state
If you live in IL ComEd, OH, PA, NJ, MD, DC, VA, DE, WV or eastern KY, the July 2025 capacity auction hits default rates from June 2026. A fixed-rate retail offer signed before then can lock in the pre-step price.
Ignore variable mass-market offers
In retail-choice states, variable products pass scarcity through with no cap. NY and IL effectively retired them for mass-market customers. If a salesperson cannot quote the maximum possible price next month, walk away.
In Texas, watch the kWh threshold
Many ERCOT plans publish a "bill credit" at exactly 1,000 or 2,000 kWh. Crossing the threshold by 1 kWh flips the effective rate sharply. Always read the Electricity Facts Label, not just the headline rate.
If you are in a regulated state, follow the rate case
In NC, SC, GA, AL, FL, ID, UT, WA or OR, there is no wholesale auction to shop. Your only lever is the utility\'s next rate case at the state PUC. Consumer-advocate offices accept public comments and frequently testify on bill impact.
Common questions about US electricity prices per kWh.
The most recent verified figure is 18.83 ¢/kWh for the US average residential rate in March 2026, published 21 May 2026 by the EIA Electric Power Monthly, Table 5.6.A. EIA updates this figure on the second-to-last Tuesday of each month with a roughly 2-month lag, so check the source for the latest reading before relying on it for budgeting.
State residential rates run from about 11 ¢/kWh (North Dakota, Nebraska, Idaho, Washington) up to 41 ¢/kWh in Hawaii. Texas sits near 14.3 ¢/kWh, California near 31 ¢/kWh, New York near 28.55 ¢/kWh, Pennsylvania around 18.5 ¢/kWh. Use the table on this page for top-5 and bottom-5, or the EIA Table 5.6.A for every state.
Three structural reasons. Fuel mix: Hawaii burns oil for baseload power because there is no interstate gas pipeline or grid interconnection; North Dakota runs on lignite coal and wind, both produced in-state. Geography: Hawaii cannot import cheaper power from a neighbouring grid; mainland states can. Policy layer: Hawaii adds clean-energy compliance costs while North Dakota does not. Wholesale competition has no lever on any of these three. The 4x gap is permanent until the underlying fuel mix changes.
Most US residential bills have three parts. Energy charge: your kWh usage times the per-kWh price (the headline rate, but it includes generation, transmission and distribution stacked together in regulated states). Customer charge: a flat $5 to $20/month for being connected. Taxes and riders: state and local taxes, plus public-benefit charges and climate riders. At the US average of 886 kWh/month and 18.83 ¢/kWh, the energy charge alone is roughly $166.84; the all-in bill typically lands around $180 to $200.
Only sometimes, and only in retail-choice states. The shoppable supply portion is roughly 40 to 50% of the all-in bill; the rest is regulated delivery and policy that no retail offer can compress. Texas (ERCOT) is the only state where competitive retail has produced consistent residential savings versus the regulated benchmark, mostly because the utility default service was disbanded in 2002. In PA, NY, IL, OH, NJ, MA and the other retail-choice states, the picture is mixed: a fixed-rate offer can hedge against a known wholesale spike (e.g. PJM-state customers locking in before June 2026) but the long-run average tracks the utility default closely.
The capacity auction. PJM's 2025/2026 Base Residual Auction cleared 30 July 2024 at $269.92/MW-day, up from $28.92 the year before; that hit ComEd, BGE and PEPCO bills in June 2025. PJM's 2026/2027 auction cleared 22 July 2025 at $329.17/MW-day, the maximum allowed under FERC's new Net CONE cap (PJM news release, 22 July 2025). That cost passes through to IL ComEd, OH, PA, NJ, MD, DC, VA, DE, WV, eastern KY, NC, IN and MI bills from June 2026 onward.
EIA's May 2026 Short-Term Energy Outlook projects residential prices will end 2026 modestly higher than March 2026, driven mostly by the PJM capacity pass-through. The wholesale energy component is forecast roughly flat as gas stays in the $3 to $4/MMBtu range; the capacity and transmission layers do the lifting. Check the STEO each month; it is the closest the US has to an official forecast.
State averages are pulled from EIA Electric Power Monthly Table 5.6.A, March 2026 reading released 21 May 2026. They are within roughly 5% of what your actual utility bills you, before you add the customer charge and local taxes. For an exact figure, read the "price to compare" or "default supply rate" on your utility bill, or your retail supplier's contract. Per-kWh prices on this page do not include delivery in retail-choice states where supply and delivery are billed separately on the same statement.
Keep learning about US energy prices
Electricity price evolution
26 years of US residential electricity prices, with the events that moved them.
Natural gas prices per therm
State-by-state residential gas prices, unit conversions, typical winter bills.
Gas price evolution
Henry Hub spot vs city-gate vs residential retail, 2000 to 2026.
What is a wholesale electricity market?
The seven US ISO/RTOs, marginal pricing, the July 2025 PJM record auction.
Deregulated states map
Which US states have residential retail choice and which do not.
Fixed-rate energy offers
How a fixed-price retail contract actually hedges your kWh price, and where it does not.
Incumbent utilities
The 170 investor-owned utilities, 2,000 munis and 800-900 cooperatives that bill you.
Who regulates US energy?
FERC, the state PUCs, the consumer advocates, and where their jurisdictions meet.
How liberalization affects you
What retail choice means for residential customers, by state and ISO.
Texas energy hub
ERCOT, retail providers, rate plans, RTC+B and the kWh-threshold pricing trap.
New York: 1998 to 2026
NYISO, the Reset Order, the $50M ESCO settlement, and why Zone J prices higher.
Illinois: ComEd, Ameren and PJM
Why the PJM 2026/2027 auction lands hardest on ComEd customers.